The Next Pitch, Unlocking the Future of Sales

Table Of Contents
- Introduction
- Data: Description and Challenges
- EDA: Understand And Analyze The Data
- Data Preprocessing: Feature Engineering, SMOTE, and ROBUST SCALER
- Model Performance, and optimization
- Deploying the model
- Further Actions
- Conclusion
Introduction
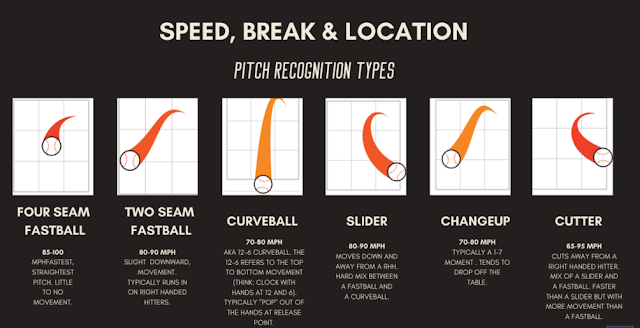
MLB pitch type classification is an integral part of analyzing baseball games. It involves categorizing the various pitch types, such as fastballs, curveballs, sliders, and more, that pitchers use to deceive batters. Accurately classifying pitch types provides valuable insights into pitcher strategy and batter performance. Leveraging data analytics and machine learning techniques, we can develop models that automatically classify pitch types based on key metrics like pitch speed, movement, and location. This empowers teams to develop effective game plans, helps batters anticipate and adjust to different pitches, and deepens our understanding of the game. In this project, my aim is to build a robust machine-learning model for MLB pitch-type classification. I will employ techniques like feature engineering, model optimization, and evaluation to create a reliable tool that enhances our understanding of pitch types and their impact on the game. Through this endeavor, I hope to contribute to the advancement of baseball analytics and strategy.

Data And Challenges
The data I'm working on consists of 918,971 entries collected during the year 2013. It includes various features such as game information, team IDs, inning details, pitch counts, player IDs, and pitch types. The dataset also provides information on runs scored by the away and home teams.
Incomplete Feature Availability: Not all features have values available before the pitch, limiting the usability of certain variables in the analysis.
Null values in pitch_type: Approximately 8% of the data is missing the pitch_type, which is the target variable. Handling this missing data is essential for accurate modeling and prediction.
Imbalanced data: The distribution of pitch types in the dataset is imbalanced, with some classes being overrepresented while others are underrepresented. This imbalance can impact the model's performance, requiring techniques such as oversampling or undersampling to address the issue.
Multicollinearity: Some features exhibit multicollinearity, indicating a high correlation between predictor variables. This can affect the model's interpretability and stability, necessitating techniques to mitigate multi-collinearities, such as feature selection or dimensionality reduction.
High Cardinality: The dataset contains features with high cardinality, meaning they have a large number of distinct values or categories. Managing high cardinality can be challenging due to increased computational complexity and the potential for overfitting. Appropriate encoding techniques, such as one-hot encoding or feature hashing, should be considered to handle these features effectively.
Outliers: The feature "at_bat_num" stands out as having a significant number of outliers. These outliers can distort the overall patterns and relationships within the data, potentially impacting the model's performance. Robust methods for outlier detection and treatment should be employed to minimize their influence.
EDA: Understand And Analyze The Data
1- Data Balance:
Class imbalance is observed in the dataset, where the pitch type "Four-Seam Fastball" (FF) dominates with a contribution of over 33% of the data. On the other hand, the pitch type "AB - At Bats" appears to be the least represented, with only two instances

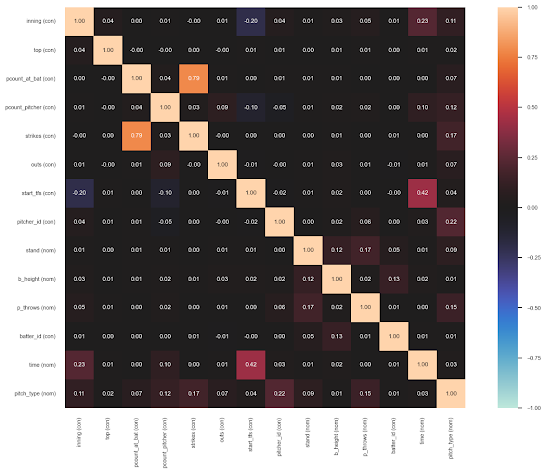
2- Correlation status:
Multicollinearity is observed among the independent features in the dataset, with the most significant contributors being the 'start_tfs_zulu' feature (timestamp) and the 'at_bat_num' feature (incrementing at-bat count). Multicollinearity occurs when these features share similar information, leading to redundancy in the model.
3- Outliers Status:

Data Preprocessing:
1- Feature Engineering:
‘time’ feature was added to the data based on the feature 'start_tfs_zulu' converting the time into 4 segments: morning, afternoon, evening, and other
2- SMOTE: Handel the Imbalanced Data using SMOTE (oversample the minority class) Technique:
Before applying SMOTE, the total number of records in the dataset was 716,681. However, after applying SMOTE to balance the class distribution, the dataset expanded significantly, and the new total number of records became 3,816,656. This represents a remarkable increase of 432.24% in the data size by creating synthetic samples of the minority class, resulting in a more balanced dataset.
3- ROBUST SCALER:
As the data has outliers that will ensure robustness to extreme values
Overfitting is evident in the model's performance, characterized by its excellent performance on the training data but a lack of generalization to unseen data. This discrepancy indicates a need for model optimization to address the overfitting issue and improve its performance on new, unseen data.

- Optimization: Strategies to Address Overfitting
- Cross-Validation: Use multiple train-test splits to better evaluate model performance.
- Feature Selection: Eliminate irrelevant or redundant features to simplify the model.
- Regularization: Implement L1 or L2 regularization to penalize overly complex models.
- Model Simplification: Reduce complexity
- Data Enrichment: Increase the amount of training data or use data augmentation.
- Hyperparameter Tuning: Optimize model parameters for better generalization.
- Ensemble Methods: Combine multiple models to reduce variance.
- Post-pruning (Decision Trees): Trim unnecessary branches from decision trees.
- Misclassified Examples Analysis: Examine and learn from misclassified instances.
- Data Leakage Check: Ensure no test data is influencing the training.
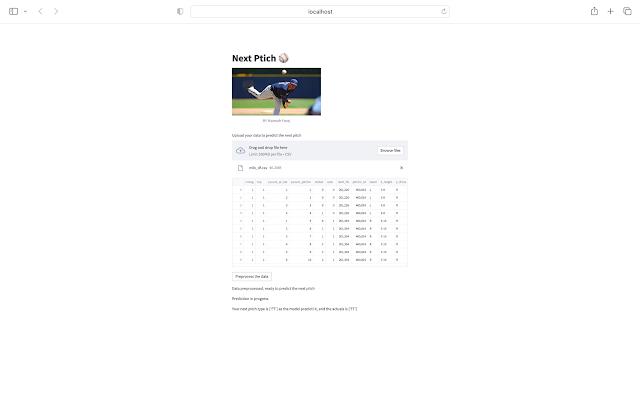
Deploy the model: Streamlit App
Further Actions:
To enhance the analysis and address certain challenges, there are several recommended further actions to consider:
1. Imputation for Null Values: Instead of dropping the records with missing values, explore imputation techniques to fill in the missing information. Imputation can help retain valuable data and improve the completeness of the dataset, providing a more comprehensive view for analysis.
2. Outlier Handling Techniques: Implement outlier detection and removal techniques, such as the quantile method or other robust methods. This will help identify and handle observations that deviate significantly from the majority, ensuring a more accurate representation of the data and mitigating their potential impact on subsequent analysis.
3. Explore Alternative Scaling Methods: Consider experimenting with different scaling techniques, such as min-max scaling or normalization, in addition to the previously used standard scaling. Different scaling methods may better suit the distribution and characteristics of the data, potentially improving the performance of machine learning algorithms and models.
4. Unshuffle the data before splitting and monitoring the results
Conclusions:
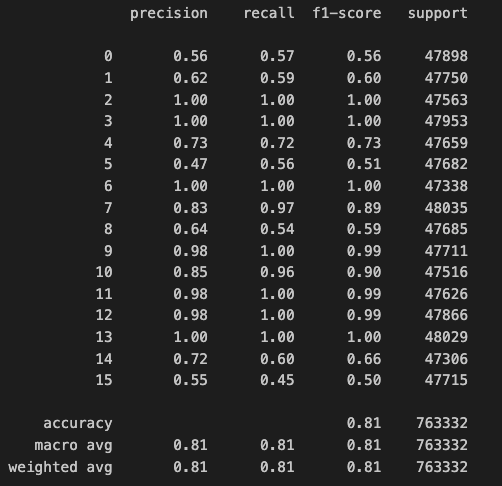
- Extra Trees Classifier model is the one with high performance, achieving 81% accuracy, followed by using AutoML, xgb_limitdepth model with 61% accuracy, and the least was using MLP (Deep learning) with 48% accuracy.
- Using RobustScaler works better than Standard Scaler on the dataset.
Tools:

Comments
Post a Comment